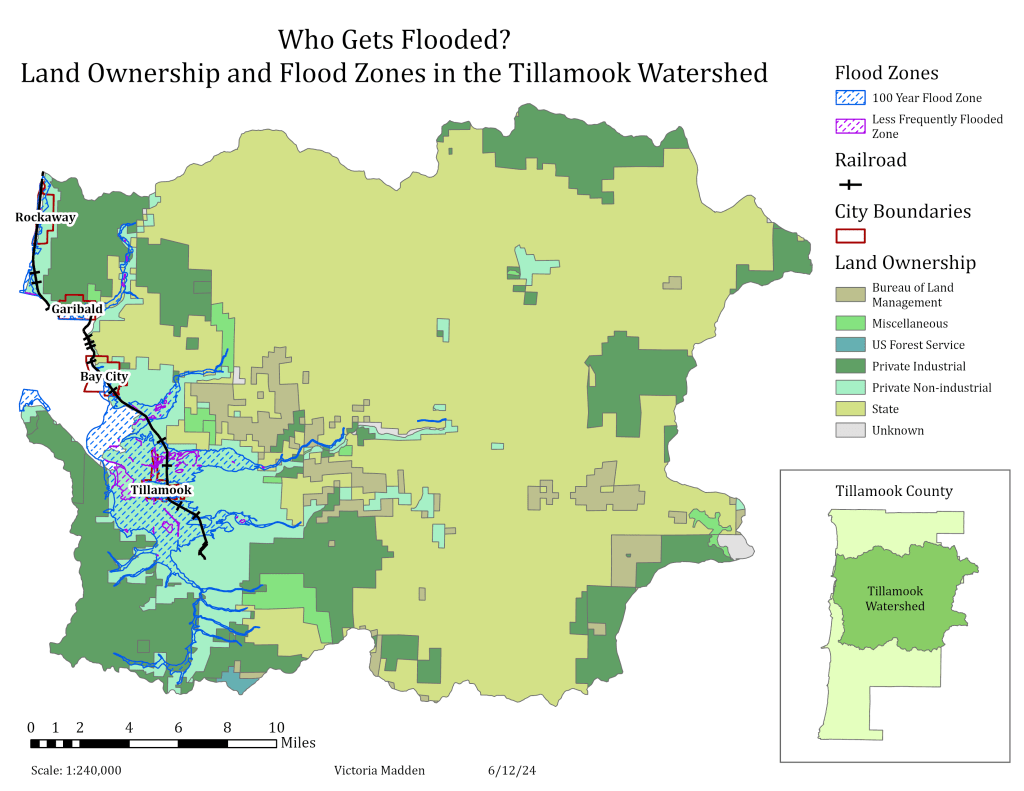
This map aims to show who owns land in the most flood-prone areas of the Tillamook Watershed. It is clear from the map that most flooding happens on privately owned land that is not used for industrial purposes, something that makes sense when thinking about who is likely to own land near rivers and water. This map can be used to help people understand the risks of buying land in certain areas so they can best plan for disaster.
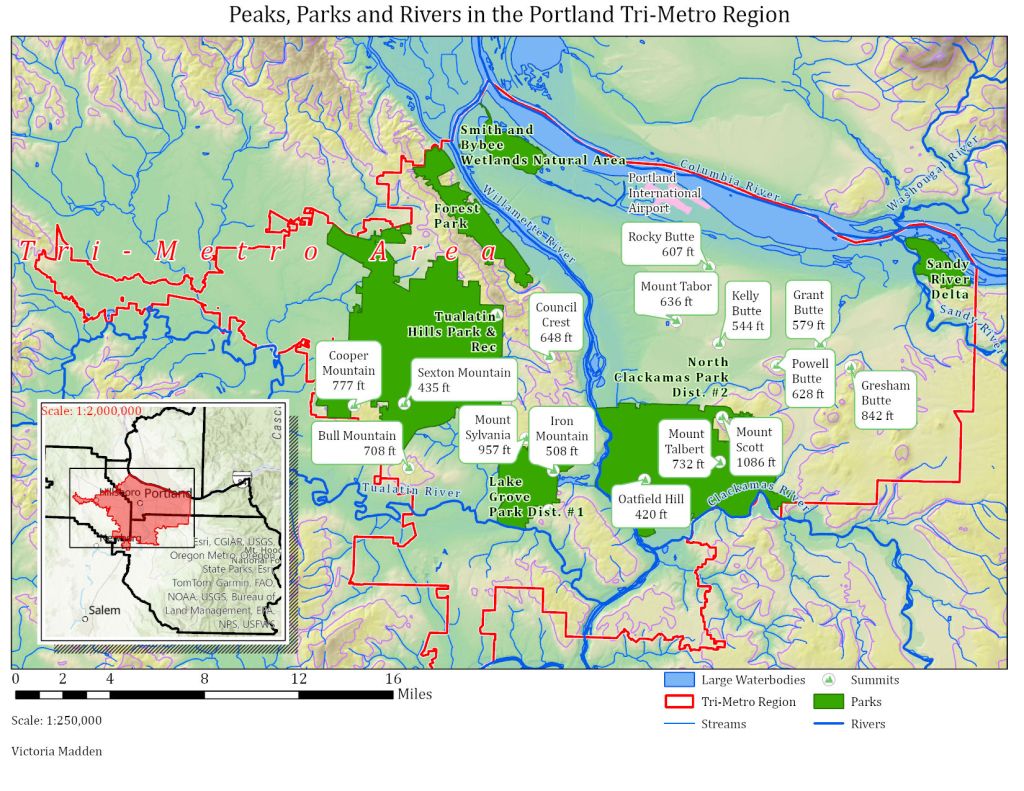
This map was an exercise in extracting, cleaning, and communicating the wealth of information found in geographic data files, including park boundaries and names, summit locations, elevations, and names, and river paths. It was important to display all these different things clearly and without obscuring any names or other information.
This map shows the various major roadways through the area of interest with each type, as classified in the source data, marked and labeled.
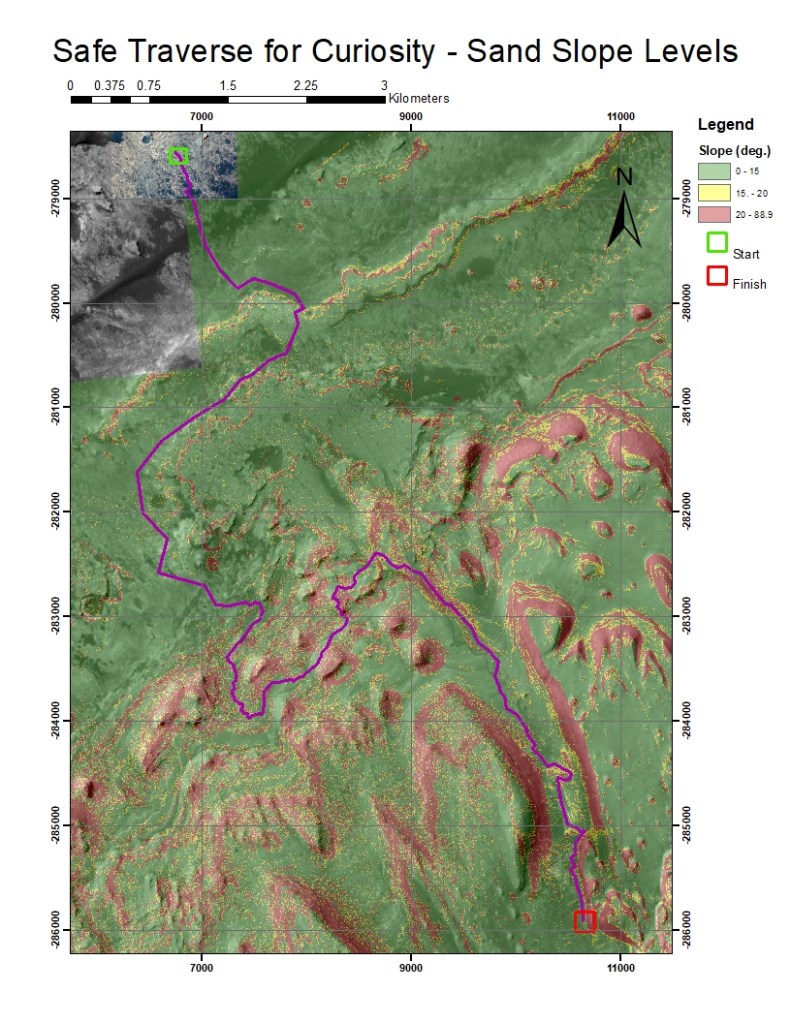
The Curiosity Rover is alone on the surface of Mars, but its teams here on Earth are helping it out every step of the way. Curiosity has different driving capabilities on different surfaces, and needs to pass by a variety of sites for thorough data collection. These maps show some optimized routes for the rover to take for safety and for science.
Green shows slopes that are completely safe, yellow slopes call for caution but are still traversable, and red slopes are unsafe for the rover to attempt.
To ensure mistakes in surface material identification don’t result in an accident, the sand map should be used for path definition for the rover.
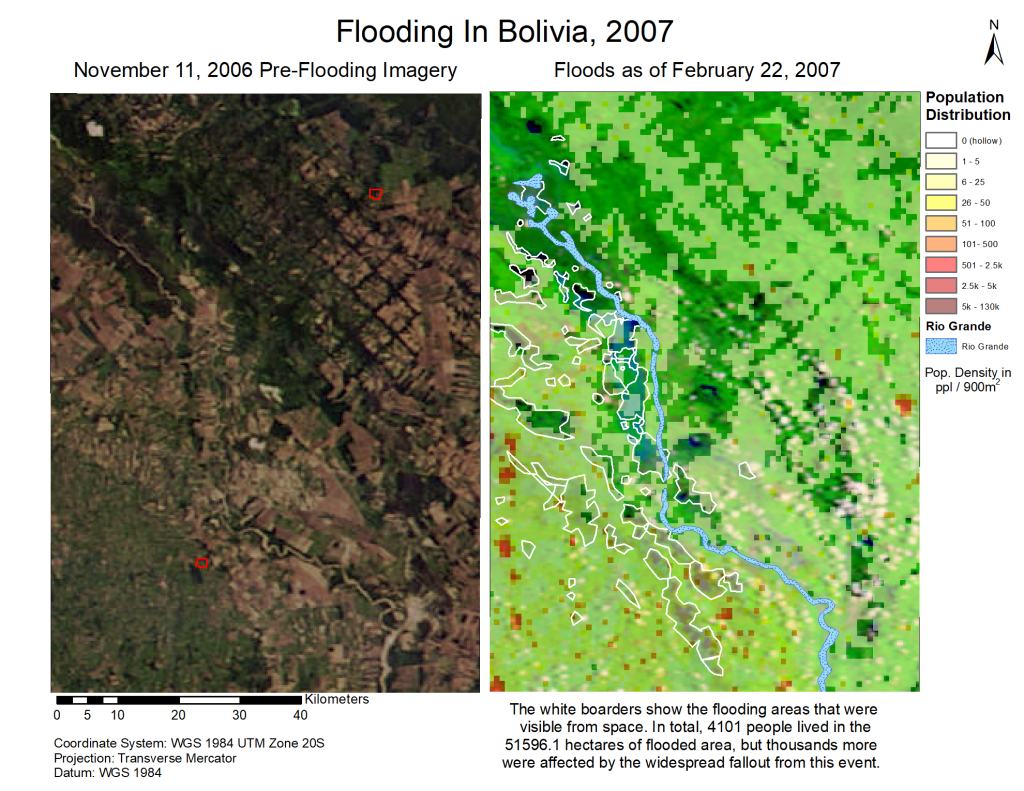
In 2007 and into 2008, heavy rains caused immense flooding throughout Bolivia. Below is a snapshot of a flooded part of the Rio Grande, which pinpoints how many people lived in in the direct path of the floods.
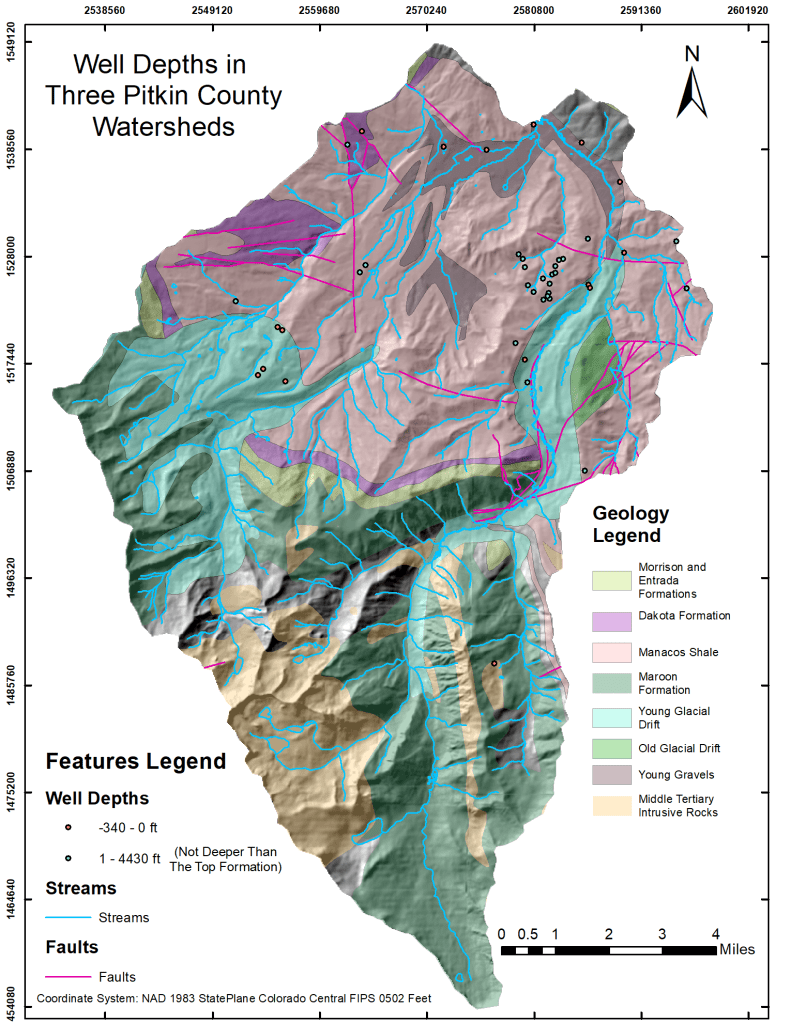
There are a lot of wells in Pitkin County, and they are sorted by watershed. This analysis determined the depths of all the wells in relation to the Alluvial aquifer (the top formation) and found which wells are assigned to the wrong watersheds.
The permit numbers indicate which wells are assigned to the wrong watersheds. If a government official were to attempt to fix their databases, this map should make that easier.
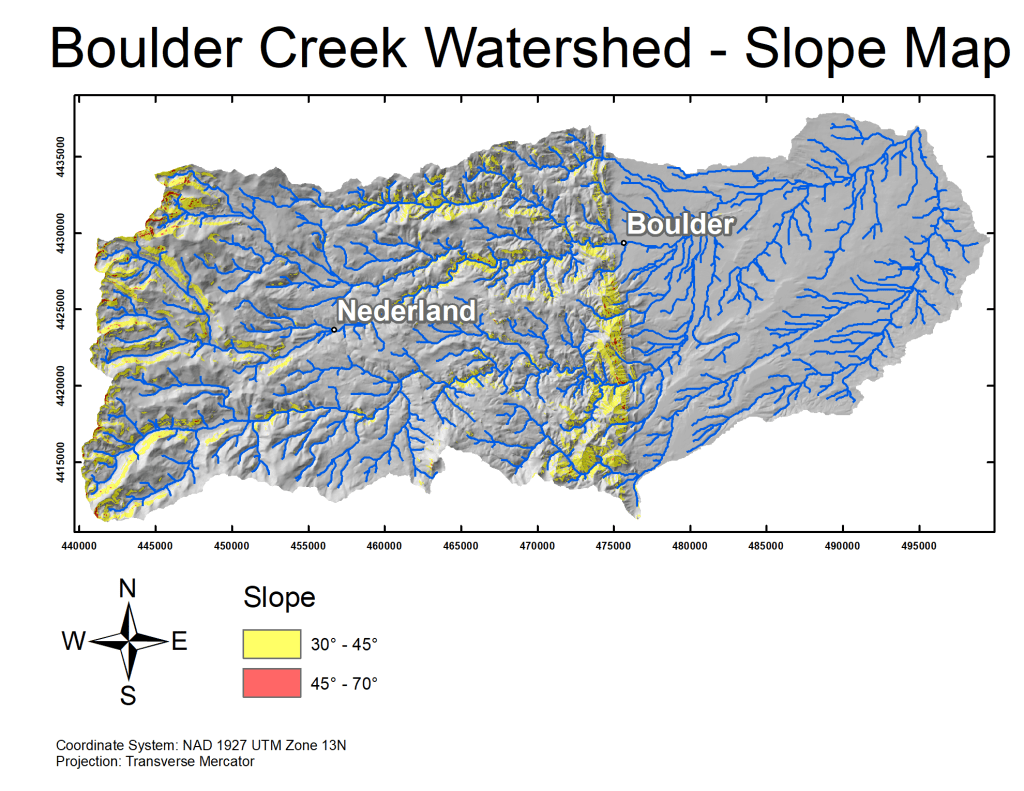
The Boulder Creek Watershed contains many tributaries and streams that flow into Boulder Creek. The map below shows the watershed, with the two main towns marked and elevation displayed in color. The streams are shown in blue. This map was created using a few different GIS tools.
The first step in defining the rivers and streams was to create a flow directions grid, shown mapped onto the DEM below. This grid determines the steepest downslope neighbor for each pixel, and defines flow as in the direction of the closest of the eight main cardinal directions to this downslope neighbor. These flow grids can be used to determine flow accumulation, which shows where the rivers and creeks are.
The flow accumulation tool in ArcGIS allows us to map the streams. A number is assigned to each pixel that tells how many pixels point towards it in the flow directions grid. After some cleaning of the data and map, the below hydrology becomes clear. The steepest slops in the area are marked to give an idea where flash floods may be fastest and most dangerous.
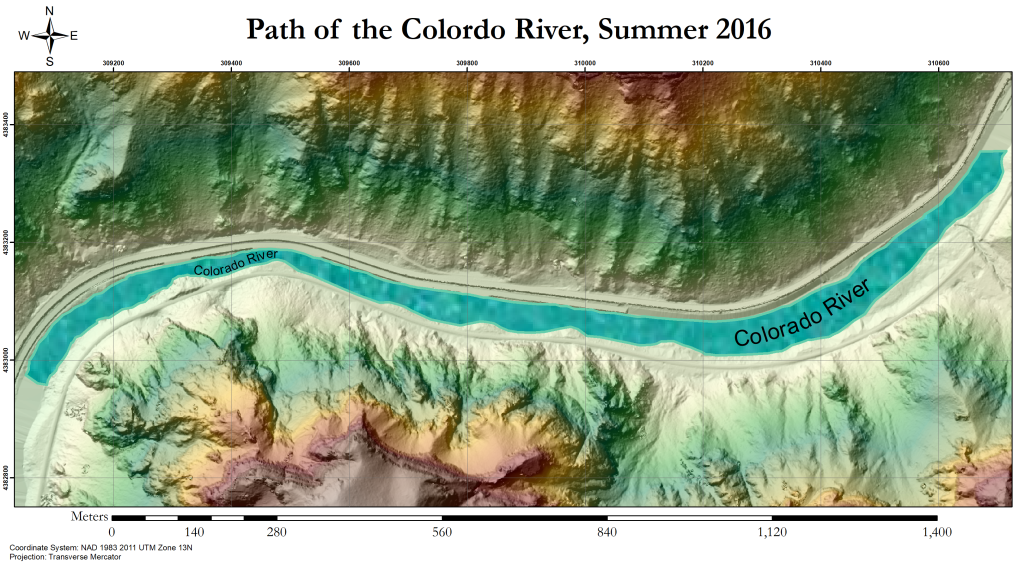
In the summer of 2020, the Grizzly Creek Fire burned 32,621 acres of the Glenwood Canyon. I grew up in Glenwood Springs and now live in Boulder. I was among the last five civilians on the interstate when the fire started, and was forced to drive around the mountains to get back to school about a week later. The next spring, heavy rainfall washed tons of mud, rocks, and other debris down the steep edges of the canyon and onto the road, the train tracks, and eventually into the river. These mudslides destroyed the interstate, the only major throughway to western Colorado. When I drive home now, I see piles of mud and dirt in the river, and I can see that the shape of the river has changed. I did this analysis so I could see exactly the difference in the river between before and after the fires.
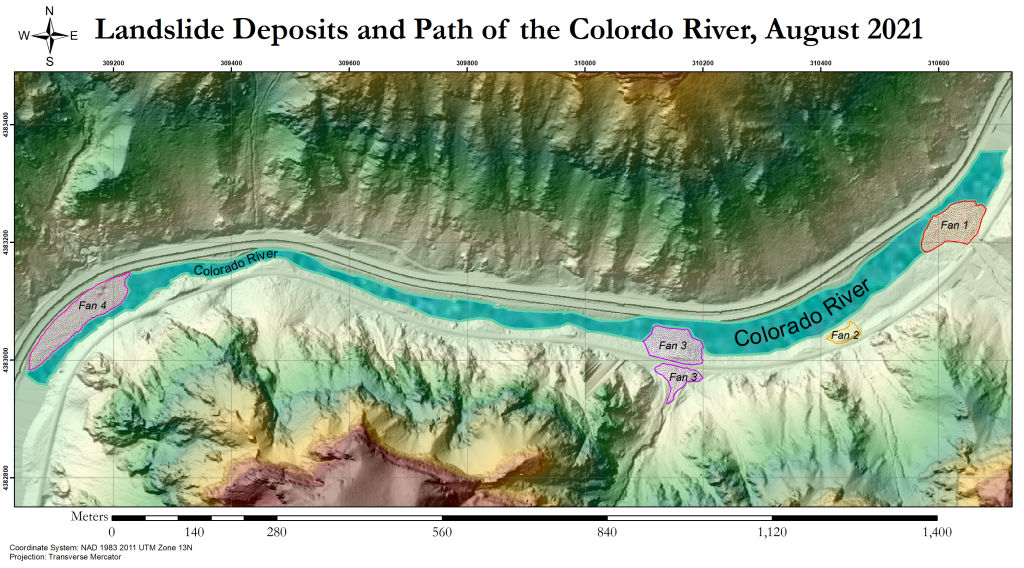
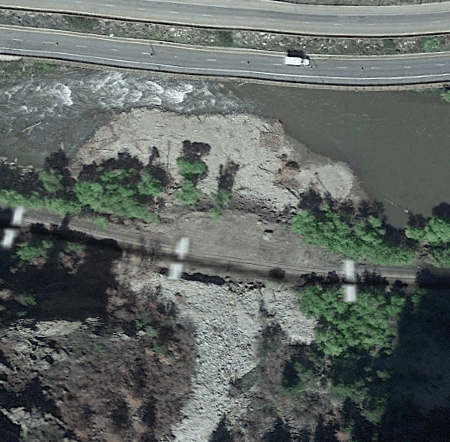
The above maps show a section of the Colorado river where mudslide debris drastically altered the shape of the river. The Colorado is a fast and narrow river, so the debris fans have been eroded away somewhat since their creation, but the riverbed still shows permanent change. Consider the below photos, pulled from Google Earth:
201720212023
These photos show the easternmost fan, Fan 1 on the map. This was the second largest fan, and buried the train tracks. The tracks had to be dug out for freight to move through the canyon.
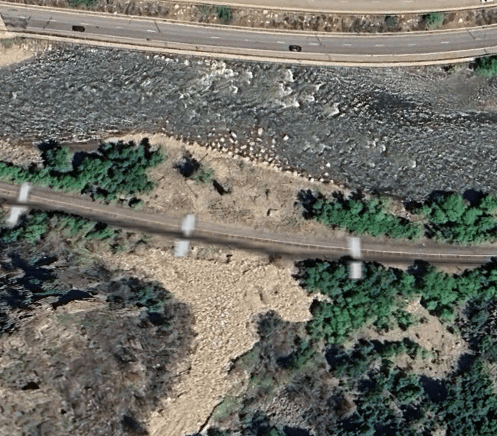
201720212023
These photos show the westernmost fan, Fan 4 on the map. This was the largest fan, and the most destructive. You can see construction vehicles in the 2021 photo trying to remove debris to repair the interstate.
The debris fans caused measurable elevation change, as shown on the map below:
This elevation change was used to calculate the volume of the fans.
Fan
Volume (m3)
1
9106
2
617
3
5033
4
18,570
Volume of each debris fan
The river had a major reduction in width due to the fans, which I used to calculate stream power to understand how the flow changed as a result. Unfortunately, there are not any discharge meters in this area, so I used numbers averaged from upstream and downstream the area of interest.
Width Before (m)
Width After (m)
Specific Stream Power (W/m2)
Specific Stream Power (W/m2)
Fan 1
39.5
11.5
379.1
610.4
Fan 4
41.8
20.6
1302.3
1238.6
Width and specific stream power for the rive at fans 1 and 4
The maps above were made with 1m resolution LIDAR flybys, and the river was traced by hand. Discharge information came from the USGS archives. All data sets and reference papers I used are listed here:
References:
1. Rengers, F.K., Bethel, M., Group, R., Vessely, M., and Anderson, S., 2023, Airborne Lidar Data (2016 and 2021) Capturing Debris Flow Erosion and Deposition after the Grizzly Creek Fire in Glenwood Canyon Colorado: U.S. Geological Survey data release, https://doi.org/10.5066/P99OT77K.
3. Bizzi, S., and D. N. Lerner. “The Use of Stream Power as an Indicator of Channel Sensitivity to Erosion and Deposition Processes.” River Research and Applications, vol. 31, no. 1, 8 Nov. 2013, pp. 16–27, https://doi.org/10.1002/rra.2717.
This analysis was compiled into a poster for presentation purposes.
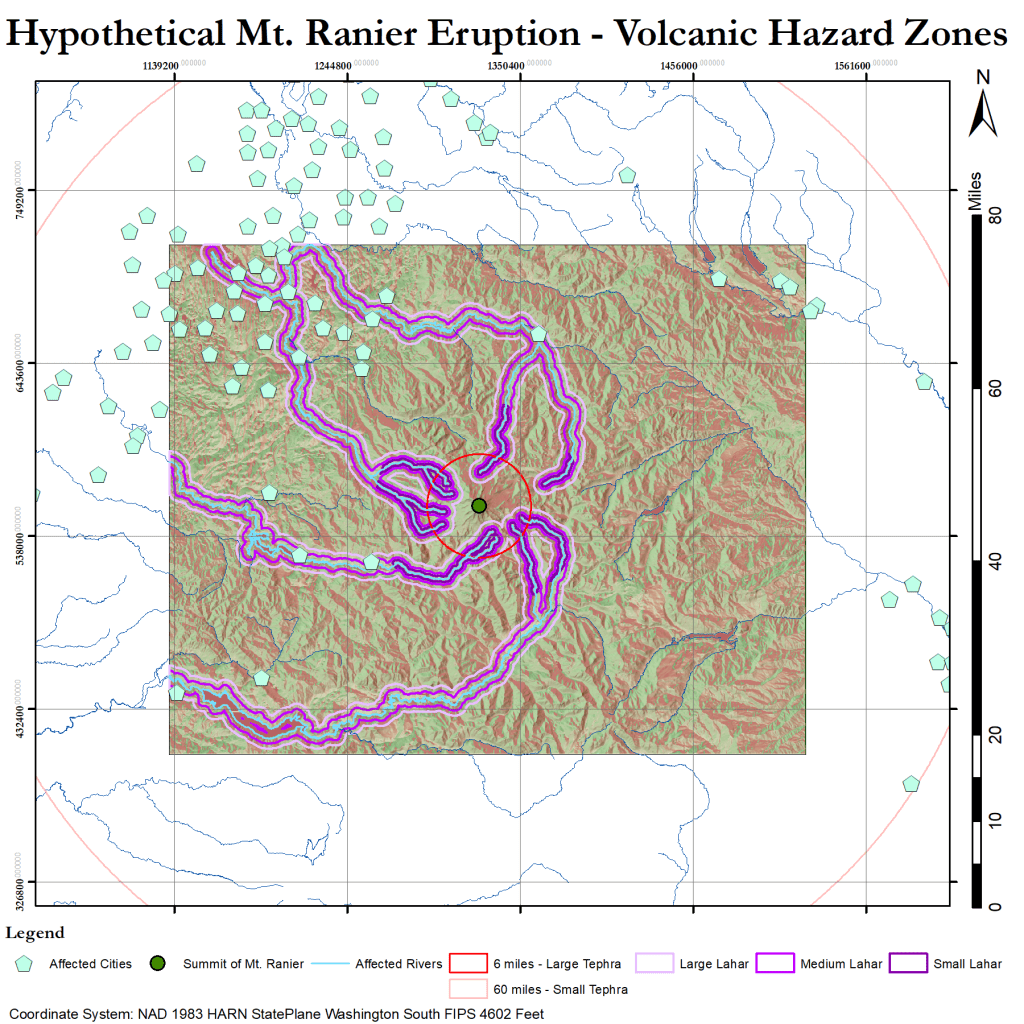
A quick look at where would get destroyed if Mt. Ranier were to erupt, and what would destroy those areas.
Mt. Ranier is a formidable volcano, and there is a lot of civilization near her. This map tracks where lahars are most likely to flow, as well as where large and small tephra would fall. There are dozens of cities right inside the small tephra zone, and 10 in direct danger of being hit by a lahar. The small lahar flows are 1 km in width, the medium 2 km, and the large 4 km. Large tephra are large enough to cause death upon impact, and may still be hot enough to start fires. Small tephra are other particulates that can fall with enough density to accumulate. the 60 mile range is where 10cm of small tephra accumulation is still considered possible. The red and green coloring on the area of interest indicate the slope of the ground.
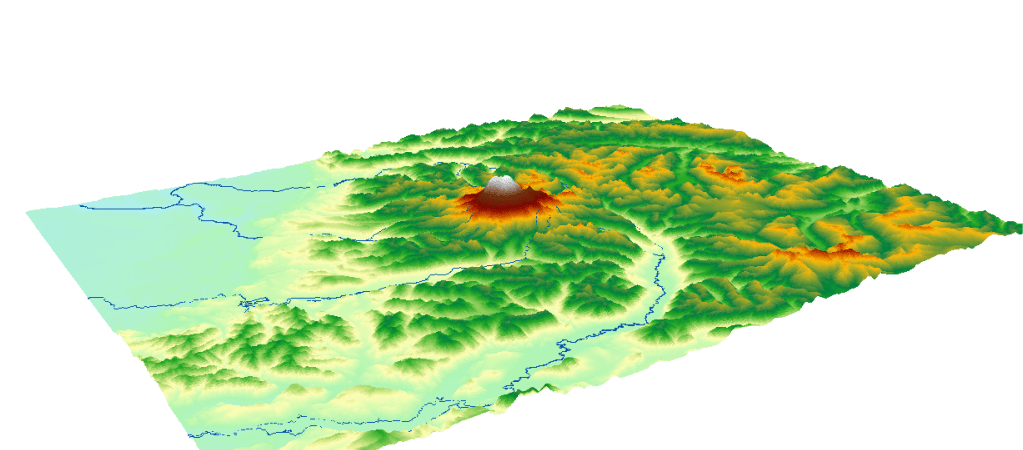
A 3D model of the region is show below for clarity.
The area surrounding Mt. Rainer, including local rivers (shown in blue).
Photo Credit: Sage Ross https://commons.wikimedia.org/wiki File:Aerial_view_of_Mt._Rainier_during_a_flight_from_Seattle_to_Las_Vegas_03.jpg


