
The Boulder Creek Watershed contains many tributaries and streams that flow into Boulder Creek. The map below shows the watershed, with the two main towns marked and elevation displayed in color. The streams are shown in blue. This map was created using a few different GIS tools.

The first step in defining the rivers and streams was to create a flow directions grid, shown mapped onto the DEM below. This grid determines the steepest downslope neighbor for each pixel, and defines flow as in the direction of the closest of the eight main cardinal directions to this downslope neighbor. These flow grids can be used to determine flow accumulation, which shows where the rivers and creeks are.

The flow accumulation tool in ArcGIS allows us to map the streams. A number is assigned to each pixel that tells how many pixels point towards it in the flow directions grid. After some cleaning of the data and map, the below hydrology becomes clear. The steepest slops in the area are marked to give an idea where flash floods may be fastest and most dangerous.
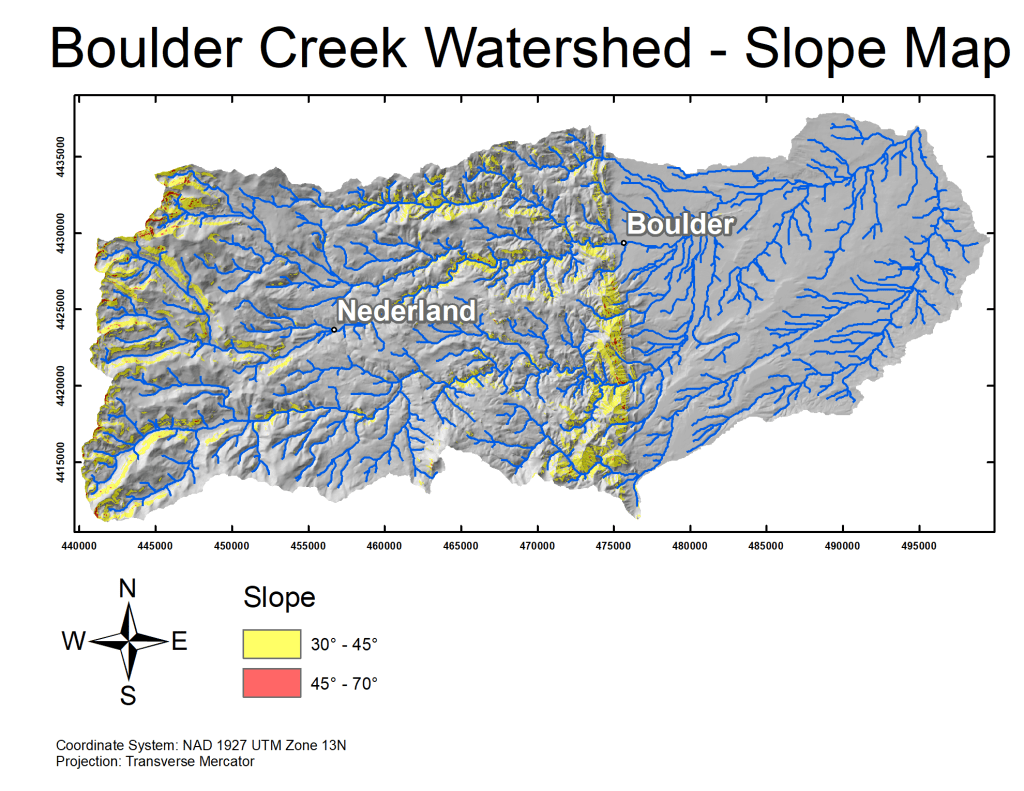
Photo Credit: https://commons.wikimedia.org/wiki/File:South_Boulder_Creek_01.jpg
